Economy

us.jpg   fr.jpg

Yield on bonds versus stocks at highest level in 11 years

71.png

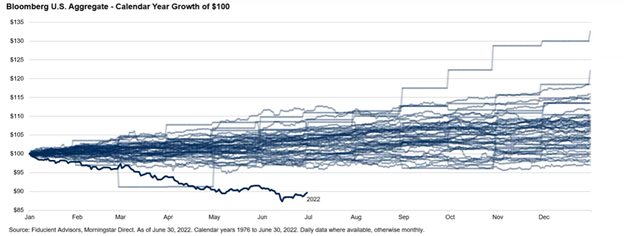
Proportion of funds that outperformed and underperformed their respective benchmarks during the initial periods

64.png

Over the long-term, moderate levels of inflation have been normal since 1750

63.png

World composite CPI, y/y percent change since 1998

60.png

10-year yields calendar year change (bps) since 1966

58.png

Annual mortgage cost as a percentage of household income since 1947

57.png

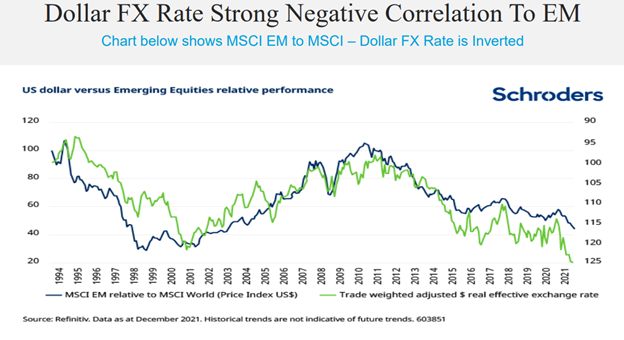
JP Morgan real broad effective exchange rate index, CPI based: US (since 1970)

53.png

US equity relative performance & US trade weighted nominal dollar since 1990

52.png

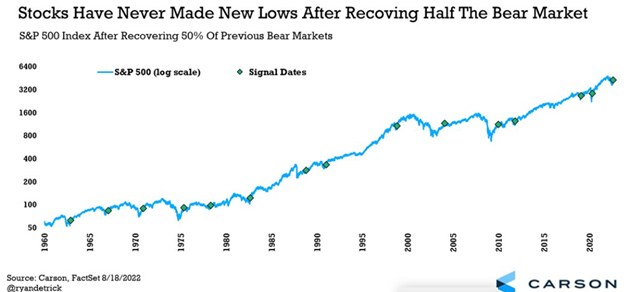
S&P 500 index (logarithmic scale) since 1957

51.png

US government bond yields as of October 3, 2022

49.png

Syndicate content