Economy

us.jpg   fr.jpg

US existing home sales months supply NSA since 2000

728.png

US existing home sales median price Y0Y percent change since 2000

727.png

S&P 500 price index since 1996

726.png

GBI weighted terms of trade vs. REER

725.png

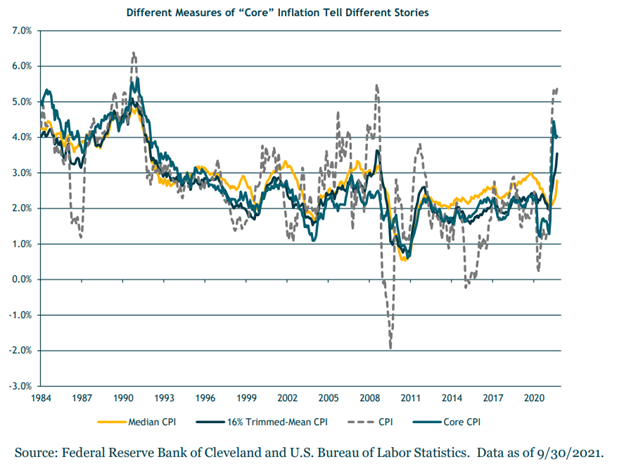
Inflation may be even higher than reported since 1980

722.png

COVID-19 vaccines were developed at breakneck speed: Timeline of previous vaccine development (years)

721.png

S&P 500 around first Fed rate hikes vs. speed of hikes

715.png

Federal reserve assets, % of GDP since 1947

711.png

Liquid alternative fund categories

709.png

Liquid alternative fund categories

708.png

Syndicate content