Economy

us.jpg   fr.jpg

S&P 500 worst performance in real terms since 1872

Picture55.png

Buffett indicator: US stock market value to GDP

Picture54.png

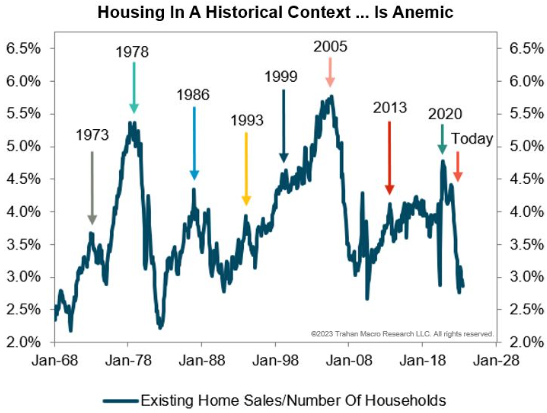
There are more homes per capita in the US today than ever

Picture51.png

US national home price changes (1891-2022)

Picture49.png

S&P 500 bear markets since 1950

Picture46.png

Inflation-adjusted monthly mortgage payment: 1989-2022

Picture40.png

Maximum sustainable withdrawal rates for retirees

Picture39.png

How much Americans get in social security benefits

Picture36.png

10 year-3 month treasury yield spread since 1960

Picture35.png

Spending methods summary, 50% equity/50% bond, 30 years and 90% success rates

Picture34.png

Syndicate content