Economy

us.jpg   fr.jpg

3-month treasury bill yield since 1928

image103.png

US home mortage 30-year fixed national average vs. US effective rate of interest on mortgage debt outstanding since 1980

image101.png

More new apartments under construction today than any time in the past 50 years

image100.png

Nominal home prices by country since 1996

image099.png

US nominal house price index since 1890

image098.png

Yields across fixed income asset classes

image096.png

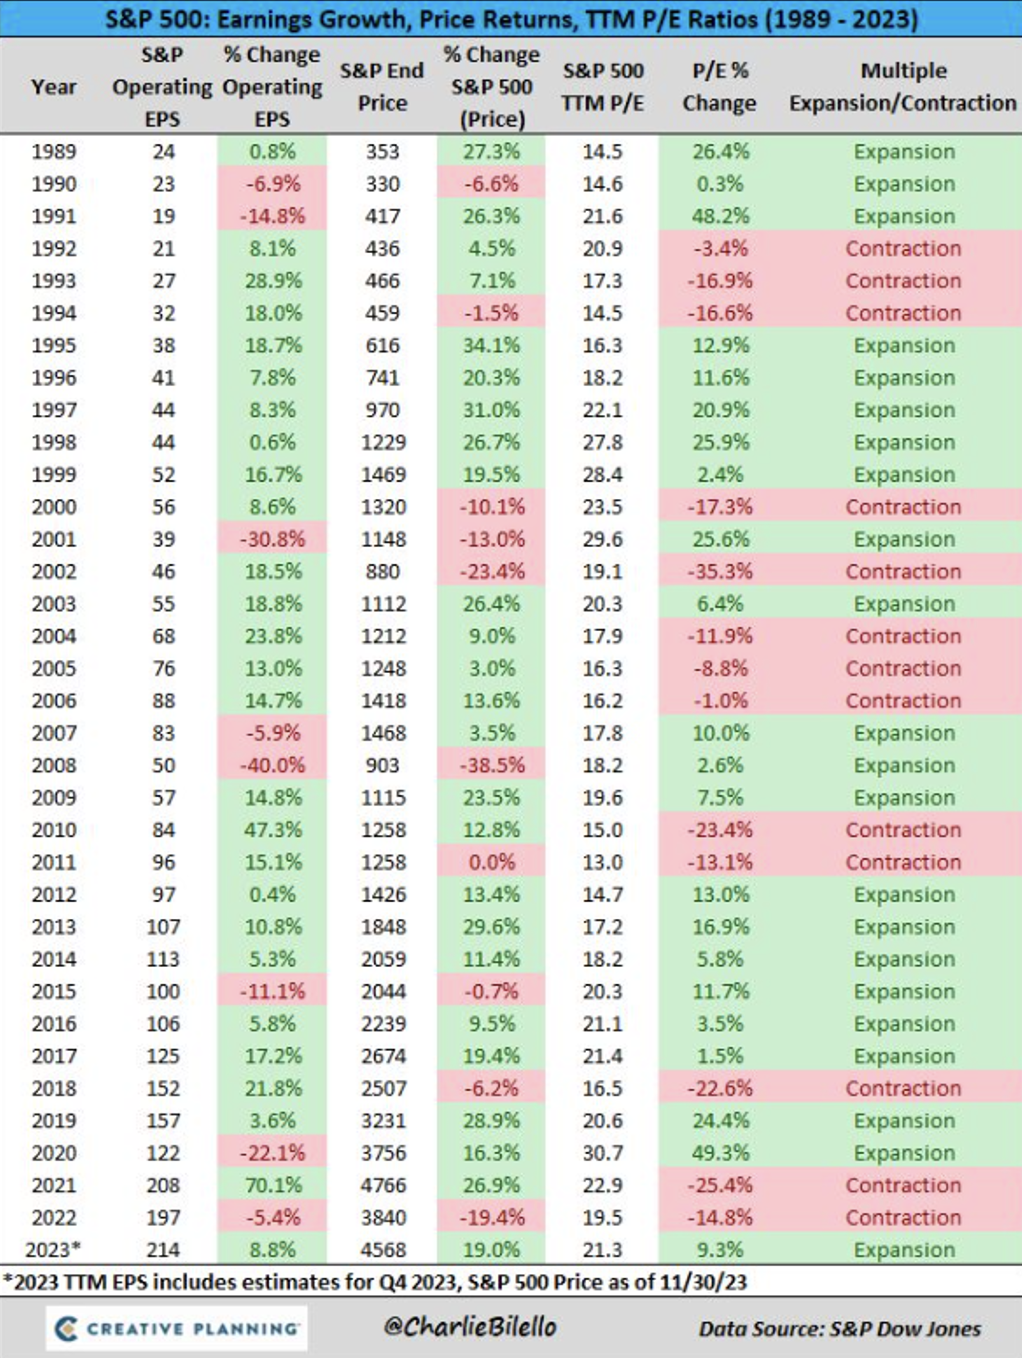
EPS growth vs P/E

image095.png

Core CPI and unemployment rate when fed starts rate cuts since 1955

image094.png

Blended U.S. money supply (year-on-year % change) since 1831

image093.png

Blended U.S. money supply (year-on-year % change) since 1831

image093.png

Syndicate content